

The RIIO EDI Review: Just how successful is RIIO?
Helen Poulter, IGov Team, 6th June 2017
RIIO stands for Revenue = Incentives + Innovation + Outputs and is Ofgem’s regulatory mechanism for the electricity and gas transmission and distribution businesses initiated in 2015, following on from the previous RPI-X regulatory control mechanism, in order to facilitate innovation within the electricity and gas networks.
The purpose of this blog is to (1) breakdown the monetary incentives in the RIIO regulation mechanism for electricity distribution networks, (2) evaluate the ED1 price control annual review, published in February this year; and (3) discuss whether RIIO has so far inspired motivation within the electricity distribution business for change.
At the beginning of each price control, in this case ED1 for electricity distribution networks which lasts from 2015-2023, the DNO’s are required to submit business plans which sets out how they intend to meet (and at what cost) the outputs desired by Ofgem as set out in Ofgem’s strategy decision.
Each network company is allowed a base revenue after a business plan and its costs are agreed. In other words, a base revenue is the amount of money the DNO is allowed to spend, and recoup from customers, to meet the agreed outputs via a Business Plan. The incentives or additional innovation allowances in RIIO are either additional or negative to this business plan base revenue. If the network company is able to deliver the outputs at lower cost than the business plan base revenue, then the network company is allowed to ‘share’ those savings with customers (as set out in Table 4). For example, Electricity North West (ENW) shared 42% of the savings with their customers, and kept 58% themselves. ENW can do what they wish with their savings, including returning them to shareholders.
A central intention of RIIO was to overcome some perceived problems with RPI-X. One problem to be dealt with was the incentive on the network companies to argue for as high a cost as possible for each price control business plan because they received a rate of return on the value of their asset base, and they were able to keep the savings. Moreover, those proposed costs became difficult to untangle if network companies put in similar costings. In other words, to the extent possible, it was in the interests of the network companies to work together. In addition, the network operators were always in a very strong knowledge position compared to Ofgem, which had to decide on whether the network companies proposed costs were ‘efficient’. This led to a very unhelpful ‘them and us’ situation with – and this is said in a very bald way – network companies gaming, and Ofgem trying to find them out. Whilst RIIO does bring in a few improvements, at root these problems still occur with RIIO – and to that extent RIIO is of minimal improvement.
REVENUE
The outputs the business plans are required to meet are:
- Reliability and availability: providing long-term reliability of supply, minimising the number and duration of interruptions and ensuring adaptation to climate change.
- Environment: reducing carbon emissions and the environmental impact of the company’s activities by managing carbon footprint, visual amenity and pollution.
- Connections: connecting customers in a timely and efficient way, and enabling competition.
- Customer satisfaction: maintaining high levels of customer satisfaction and improving service.
- Social obligations: helping vulnerable customers.
- Safety: providing a safe network in compliance with Health and Safety Executive (HSE) safety standards.
Ofgem comes up with a benchmark of all DNO business plans against their assessment of efficient expenditure and value for the customer. Ofgem do this (in brief) by deciding on what they think reaching an output will cost, and in part they decide on this from the costs in the various proposed DNO business plans. If Ofgem deems a DNO business plan to be realistic and well-designed (i.e. a business plan, and cost, which fulfils the required outputs and provide values to customers) the DNO can be fast-tracked and the company’s price control settled early. The successful DNOs then receive a financial reward of 2.5% above the allowed business plan base revenue and a higher efficiency incentive rate in lieu of the Information Quality Incentive (IQI). This is intended to reduce the incentive on utilities to put in as high a proposed base revenue as possible. For this to be worthwhile to the utilities this 2.5% has to be greater than any saving they might make from an underspend. This is discussed below.
Western Power Distribution (WPD) was the only DNO company to be fast-tracked and their modified licence was issued in May 2014. They were given an efficiency incentive rate (or sharing factor) of 30%. This means that for any underspend 70% of equity is available for WPD (including investors if they choose to return it as dividends) whilst the 30% would go to reduce customer bills, and vice versa for any overspend. For example, as set out in Table 4, if WPD fulfils all its outputs for £6679m rather than the agreed £7479m, thereby underspending by £800m, then company would earn £560m before tax whilst £240m would go to reducing customer bills at the end of the price control. The remaining DNO’s are then able to be slow-tracked and are eligible for the IQI mechanism.
The IQI enables DNOs, which are not fast-tracked, to re-submit their business plans in order to produce a plan closer to Ofgem’s requirement. The re-submitted business plans are held up to closer scrutiny regarding their outputs and whether Ofgem believe these to be good value for consumers. A benchmark figure for their base revenue allowed is interpolated. (interpolated means a way of creating a value from other values).
In this case the benchmark figure for Ofgem is that which Ofgem decided on before (see above).
- Each DNO resubmits a business plan.
- Ofgem averages the DNO business plans with a margin for error.
- Ofgem then decides on a top 25% margin for error in the DNO forecasts.
- Ofgem creates an average range weighted 75% for Ofgem’s original benchmark and 25% for the DNO margin for error.
- This range then becomes the IQI benchmark.
- This IQI benchmark is then used to assign the DNO efficiency incentive rate (sharing factor).
- The sharing factor is higher i.e. percentage given back to investors, for those DNO’s who are closest to the benchmark case (see table 4 for actual DNO ED1 sharing factor percentages)
INCENTIVES
There are some monetary incentives to achieve the desired outputs listed above. These are either funded with a two-year lag, with rewards/penalties added to the allowed revenue the year after the annual review, or as an adjustment for ED2 in 2023.
Reliability and Availability
The most important monetary incentives are within this output:
- Interruption Incentive Scheme (IIS) – performance against target for number and length of planned and unplanned network supply interruptions, not includingexceptional events, cut-out failures and short interruptions – ± 2.5% of the Return of Regulatory Equity (RoRE).
- Guaranteed Standards of Performance (GSoP) – states the minimal levels of performance regarding interruptions. Payments made directly to customers for any failure to meet these levels, capped on a per customer basis with different levels for domestic and commercial.
- Monetised risk – performance against targets for health and criticality of assets – ± 2.5% of base revenue for the ED2 period plus an increase or decrease of allowed revenue in line with justified costs.
- There is also a funding pot of £76.5m (0.02% of average allowed revenue) for the DNOs to bid for during the ED1 period to improve reliability for the worst served customers on a use-it-or-lose-it basis.
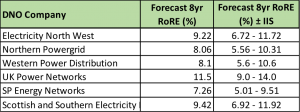
The IIS has the opportunity for companies to increase their RoRE, the financial return achieved by investors during the price control period. What this means in practice is that the ‘profit’ return the DNO is allowed within the Business Plan can be increased, or decreased, by up to 2.5%. In effect, if the DNO meets its target then, for example, an agreed 8% return would increase to 10.5% (see table 1).
Table 1. ED1 RoRE figures for DNO companies
Monetised risk is an indicative measure of two risks (1) asset health , which assesses age, condition, fault history and probability of failure of the DNO’s assets (the technology needed to transport electricity), and (2) criticality, which assesses the financial implications of a failure of that asset. The DNO’s forecast the costs of these risks with and without investment. Ofgem use the DNO forecasts to create overall targets for improvement to which the DNOs must comply. These are accounted for in the middle and end of the ED1 price control. Any underspend below the target Ofgem has given must be justified or will lead to a reduction in allowed revenue for ED2. This reduction is based on the avoided cost of investing in the assets plus a penalty of 2.5% of the value of the under-delivery i.e. if the value of the underspend was £1m, the penalty would equal £1m + 2.5% of the £1m. If the DNO over-delivers on these investments, and again this must be justified, they will receive an increase in their ED2 allowed revenue and a 2.5% reward based on the value of the over-delivery based on the same method of calculation. So for all DNOs, if any of their overspend is monetised risk, and they are able to justify this, then they will be able to increase their ED2 allowance. The same can be said for those DNOs who underspend, enabling them to keep providing high investment returns and customer savings for ED2.
There are no specific penalties/rewards for any of the environmental sub-headings. However DNO’s are obliged to produce an environmental report including how they plan to transition to a low-carbon economy, which is part of their licence obligation.
Connections, Customer Service and Social Obligations outputs
There are a range of penalties and rewards for connections, customer service and social obligations:
- Time to Connect Incentive for smaller customer connections that gives a financial reward of up to 0.4% of base revenue.
- Incentive of Connections Engagement (ICE) for larger customer connections that incurs a fine of up to -0.9% of base revenue.
- A connections GSoP that gives direct customer payments
- Customer satisfaction survey ± 0.5%
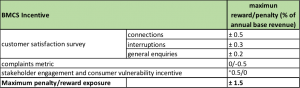
The penalties and rewards within the Connections, Customer Service and Social Obligations outputs come under the umbrella of the Broad Measure of Customer Satisfaction (BMCS) (Table 2) – an overall reward or penalty of ± 1.5% of base revenue.
Table 2. Broad Measure of Customer Satisfaction breakdown of possible incentives.
Safety
Safety is imposed by the Health and Safety Executive (HSE). The HSE are able to serve notice on any DNO in breach of health and safety regulations which can result in reputational damage, fines or imprisonment.
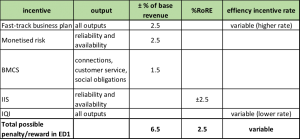
In summary, the incentives available add up to a possible 6.5% increase or reduction on base revenue allowance. Equity shares for investors/customers are variable dependant on the quality of the business plans whilst there is a possible 2.5% increase or reduction in the value of investment (Table 3).
Table 3. Summary of the high value incentives for the ED1 price control.
Review situation of forecast performance after 1 year
Table 4 provides figures of the ED1 allowance and forecast spend for all the DNOs, without any of the incentives they can earn. These are the figures provided to review whether or not RIIO and the ED1 agreement is on track or not. The allowance is the finally agreed business plan with Ofgem of ED1. The forecast is a new figure put forward by the DNO’s after a year’s work which is their best assessment for their expected expenditure in order to meet the outputs they signed up to in ED1.
Table 4. Allowed expenditure over the ED1 price control with DNO sharing factor. Forecast spend is taken from the ED1 annual review forecast. The sharing factor percentage rate is that available for customer savings, therefore the remainder is available equity for investors. These figures are not inclusive of possible output incentives.

For example, in Table 4, WPD who were the only company to be fast-tracked, submitting a business plan which met the objectives set out by Ofgem, show a forecast overspend by 5% of their agreed business plan allowance. In other words Ofgem allowed them £7,479m and now WPD is saying that ED1 will cost them £7,902m (i.e. 5% more than £7,749m). It seems that WPDare relying on the incentives (up to 6.5%) in order to ‘break-even’, given their overspend of 5% above the allowed revenue. This suggests that WPD, in order to be fast-tracked, may have submitted a lower figure to the EDI process in order to show good value for customers. If WPD are unable to reduce their over-spend there will be a rise in their customers’ bills.
However, UKPN, whose business plan was the worst performing amongst the DNOs, as can be seen from their sharing factor, are able to offer their investors and themselves a higher return, and their customers greater savings over the ED1 period, as they have been able to achieve a £929m forecast underspend and an 11.5% RoRE.
In the ED1 Annual Review report the executive summary states the performance of the DNOs would achieve an overall reduction in bills for customers. This is true if you take an average of all DNOs, but if the individual network companies pass their profits/losses onto customers then only UKPN customers will notice a reduction and it is their large underspend that effects this overall DNO average.
INNOVATION
In 2015 Ofgem replaced the Low Carbon Network Innovation Fund (LCNF), which contributed £250m of innovation funding over its 6 year lifetime, with a number of other mechanisms: the Network Innovation Competition (NIC), the Network Innovation Allowance (NIA) and the Innovation Rollout Mechanism (IRM).
Network Innovation Competition
The NIC is an annual competition into which DNO’s can bid, along with other licensee’s, for funding for large-scale, flagship innovative projects. Ofgem awards funding if it assesses there are consumer benefits to the project, which it recovers from Transmission Use of System Charges (TUoS). The current level of funding has been reduced from £90m p.a. to £70m p.a. in total for all distribution and transmission electricity networks. Ofgem’s consultation report states that this is to stimulate more competition between applicants and improve the quality of applications. The licensee’s i.e. the actor/company who has put forward the project, will have to make a 10% contribution towards the costs of any funded project.
Out of the six DNO’s, two were awarded NIC funding – Electricity North West (ENWL) for Celsius – a project to manage the temperature of electrical assets in distribution substations. It hopes to identify areas of the network, which are not using their rated thermal capacity and therefore reduce the need for expensive network upgrades in the future. SP Energy Networks (SPEN) for ANGLE-DC – to convert an existing 33kV AC circuit to DC reducing it to ±27 kV DC, therefore allowing extra capacity for the integration of renewable electricity. Although both of these projects will help increase capacity of the existing networks, and therefore the efficiency of the DNOs, they are reasonably conventional, run-of-the-mill type projects. Bids for this year’s competition have included three out of seven on the future role of networks so there may be improvement in the future.
Network Innovation Allowance
The NIA is a use-it-or-lose-it fund based as a percentage of base revenue; the percentage rate is dependent on the quality of the innovation strategy in the DNO’s business plan. Networks may use this to fund smaller research, development and demonstration projects. Following the annual review, DNO’s will have to give explicit reasons as to why their projects should be eligible for funding as oppose to the present system where they just have to state that they are.
Each of the six DNO companies have released an Annual NIA Summary (breakdown of funding Table 5 below), which are available here and here. As can be seen from table 5 the average NIA allowance was 0.5% of the business plan base revenue whilst the NIC funding was just 0.27% of the total allowed revenue for all the 6 distribution companies.
The majority of the innovations relate to helping achieve the incentivised outputs set out above i.e. those which have a monetary value to them, in the ED1 framework. There are projects assessing the use of new technologies such as storage, micro-grids and demand-side response (DSR), but they are not the majority. The network’s innovations concentrate on improving asset health, capacity and reducing faults. Again, this is more to do with traditional efficiency measures rather than for future networks.
Table 5. NIA and NIC funding, allowances and spending for the ED1 annual review (1 year only)

Innovation Rollout Mechanism
The Innovation Rollout Mechanism (IRM) is to provide companies a way to de-risk the rollout of an innovation that may not provide sufficient company benefits, but would provide greater environmental benefits. The funding is available for application in 2017 and 2019 during the ED1 period, and is available to rollout innovations from the previous innovation mechanism – the Low Carbon Network Fund (LCNF) Tier 1 and 2, and the Innovation Funding Incentive (IFI), as well as NIC and NIA projects. There were no application for funds in the 2017 window – making the benefit of the LCNF projects questionable.
Conclusion
Clearly, RIIO is an improvement on RPI-X. RIIO implies that incentives, innovations and objectives are all linked to better revenues. At present, the innovation incentives are more focussed on money for pilot schemes. The hope is that these will feed back into the everyday behaviour of utilities. However, at the moment, it can be seen that RIIO is still very limited for incentivising doing things differently. Moreover, there are no direct incentives linked to environmental outputs.
Ofgem have reduced the capacity somewhat for networks to ‘game’ the base revenue allowance, but the incentive is still strong. For example, UK Power Networks have managed to achieve a £929m forecast underspend (Table 4) and an 11.5% RoRE (Table 1), which will not be changed until 2023. This shows that there is still a fundamental flaw in the benchmarking process.
There have been positive steps in some areas, such as the BMCS focussing on consumer interests, suggesting that Ofgem understands the importance of putting customers at the centre of a DNO’s business. The report also points out that the DNOs met their outputs but does not review whether this was achieved using any NIC or NIA projects that did not need to use the rollout mechanism. Some of the DNO’s used innovation funding to invest in projects such as micro-grids, low-carbon cities, local energy markets and active network management. However, these are still in the minority and none of the pipeline projects, either from RIIO or LCNF initiatives, applied for rollout funding.
The average NIA allowance is 0.5% of allowed annual revenue and NIC 0.27% of the total allowed revenue of all the DNOs, which is minimal compared to the amount of change and innovation the networks need to achieve. The incentives should be greater in the main and should not be a discrete separate pot. There are a number of ways this could be achieved. IGov is arguing for the transfer of DNOs to distribution service providers which are regulated in new ways – a higher proportion of their revenue is to be related to performance based outcomes.
Perhaps most importantly, RIIO requires benchmarking – which is a very time consuming, and intrusive, regulatory mechanism but also a mechanism which ultimately requires utilities to be similar. Given the enormous changes underway it seems that benchmarking as a way to encourage innovation, could be argued, as being too constraining. Potentially, a preferable incentivisation mechanism is on performance based regulation, without the benchmarking . RIIO gives the impression of ‘ticking boxes’ rather than creating a concrete plan for future networks.
The energy system is changing, and needs to change, rapidly and there seems to be a lack of vision amongst some within BEIS, Ofgem and the DNOs with respect to innovation and incentives. In a world where technological change occurs at this rapid pace, legislation and the networks will end up being reactionary, fighting to keep up, unless the incentives on networks are sufficiently strong. Although within RIIO there are good ideas as to how we need to make that step, the fact is we no longer have the time to allow changes to happen as slowly as they are.
In the short term we argue that there would be more value to companies being committed to producing a DER plan of their DNO areas over a 2 year process to recognize the value of future network systems, and to bring interested parties together.
In order to achieve an energy transformation, multiple dimensions need to come together. This is not just legislation, institutions and technology, but with the ‘ways of being’ of the actors, customers and people. RIIO is an attempt to do this, but is still far from successful even on its own terms, and anyway is very cautious.
Posted by: Iain Soutar
Related Posts
« Previous Global Insight 6: 30 May 2017 Global Insight 7: 6 June 2017 Next »
