

Tales of the unexpected: A policy success story?
Helen Poulter, IGov Team, 25th July, 2018
This blog has been written to provide an analysis of how Australia became the world leader in the percentage of households installing small-scale PV (<100kW). It will introduce the initial policies that were put in place at the national and state level which were intended to capture Australia’s solar resource to help reduce the country’s emissions. The blog will discuss other unrelated events happening at the same time which culminated in higher than expected adoption rates. It will also comment on how high prices, confusing tariff structures and poor customer service has made energy companies unpopular with their customers.
The blog describes the policy responses to the various events. It is the intention of this blog to show why it is essential to allow for adaptability in policy design and regulation to enable coordination of rapid change.
Small-scale renewable energy policy
In 2008 as part of their own renewable energy targets, and to encourage early adopters at a household and commercial level, each of the Australian states introduced their own incentives for small-scale solar (<100kW). These state designed schemes were a Solar Bonus Scheme (SBS) in New South Wales (NSW) and a Premium feed-in- tariff (FiT) in Tasmania (TAS) and the Australian Capital Territory (ACT). The SBS and Premium FiT paid between 44c/kWh and 60c/kWh dependent on state regulated tariffs for all PV generated electricity. South Australia (SA), The Northern Territory (NT), Western Australia (WA) and Queensland (QLD) had a net FiT which paid 44-60 c/kWh for electricity that was fed back into the grid. All state schemes were initially open to unlimited size of domestic system but then curtailed to 5kW. In 2012, the schemes closed to new entrants and the tariff reduced to around 8c/kWh. Those whose systems were registered and installed before the 2012 deadline would receive the initial Premium or Net FiT or SBS until 2028.
In 2011 the Small-scale renewable energy scheme (SRES) was introduced as a measure to encourage individuals and small businesses to invest in eligible renewable energy (RE) systems. The scheme will run until 2030. SRES certificates are produced for new renewable generation by solar PV, wind or hydro and for the energy displaced by a solar water heater or heat pump over the course of a designated period. The certificates can be generated by the owner of the eligible technology or by an installer who has been assigned the right to generate the certificate by the owner. As one certificate is equal to 1MWh small-scale RE installers are able to aggregate smaller RE systems to reach the 1MWh target and pass on savings to the customer. The certificates are sold to energy retailers, who are required to surrender an amount of certificates each year, through a spot market or through a Government Clearing House. The value of the certificates is dependent on the spot market price, currently $35.50/MWh. They can be traded through the government Clearing House at $40/MWh. Certificates will only be traded through the Clearing House if there are no certificates available through the spot market. The added benefit of the scheme is that it gives the Australian Energy Market Operator (AEMO) visibility of the location and density of behind-the-meter RE which allows for better forecasting for grid demand.
Rising energy prices
In 2010-2012 there was a steep rise in the cost of energy. Various factors combined to cause this rise:
- an expected growth in electricity demand
- retirement of old coal thermal plant and
- switching to gas generation for gas peaking plants and baseload power at a time when global gas prices were increasing.
Forecasts had predicted an increase in electricity demand which would require new infrastructure and generating capacity. In fact demand fell which meant that electricity companies invested in unneeded infrastructure. The incorrectly forecast increase in demand meant that the electricity networks augmented their power lines for an expected increase in a one-way flow of energy. These investments then formed part of the networks regulated asset base (RAB). The return on these investments accounts for more than half of the network businesses total revenue. This high revenue, and hence a continuing high RAB, leads to high network charges for consumers. In Australia the network charges currently make up around 40% of customers’ bills.
Old coal thermal power plants were retired and replaced with combined cycle gas thermal power plants (CCGT). At this time there was an increase in global gas prices which, as there were now more CCGT plants, increased prices for consumers. The increase in global gas prices also led to the development of 3 LNG export projects in Queensland. These export developments limited the availability of local gas for the domestic gas market. This decrease in the supply of a domestically available gas caused wholesale gas prices to rise further, affecting the cost of electricity supplied by gas generation in the National Electricity Market (NEM).
Forecasts by the Australian Energy Market Operator (AEMO) (Figure 1) predict more increases for residential electricity prices in 2020, between 15-20% higher than 2016 levels. Future price rises have been forecast due to a continuing reliance on gas for future electricity supply. In particular South Australia (SA) and Queensland (QLD) are more reliant on gas generation for baseload power. It is also forecast that commercial and industrial users could see increases in electricity prices of 20-40% compared to 2016 levels by 2037.
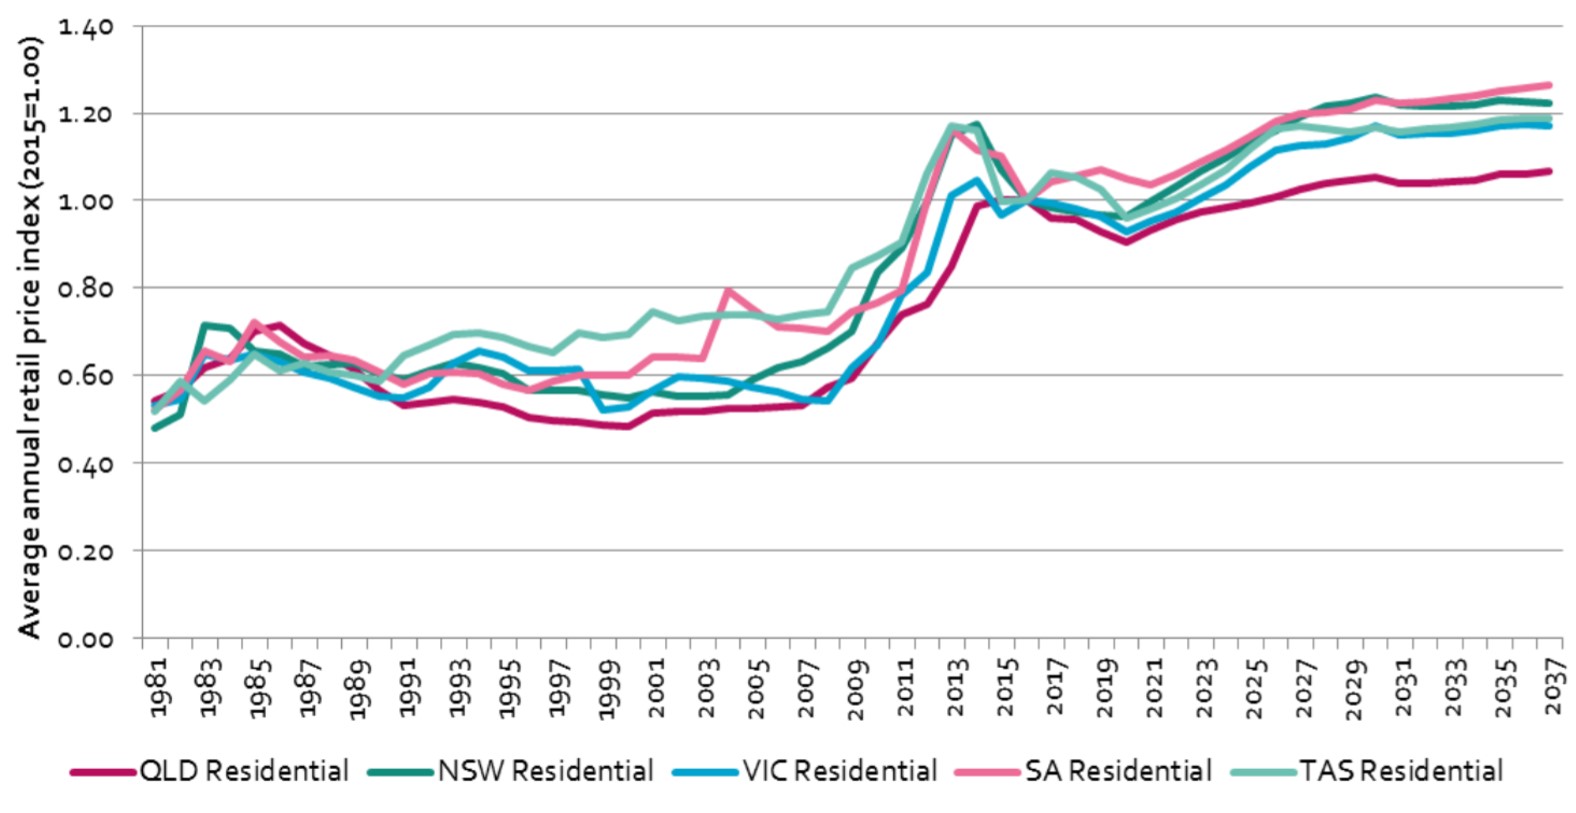
Figure 1 Real indexed residential retail prices – historical and forecast, neutral scenario (2016=1.00)
Reducing costs for solar
Between the years of 2008 to 2014 the global price of solar PV modules declined by a staggering 79%. In Australia, prior to subsidy, average system price (the cost of PV panel plus associated equipment) fell from $12/W in 2008, to $6/W in 2010 and to $3.10/W in 2013 (Figure 2). This reduction in the cost of system plus subsidy from SRES payments and the generous FiT rate saw a record number of domestic PV systems installed between 2010 and 2012 (Figure 3).
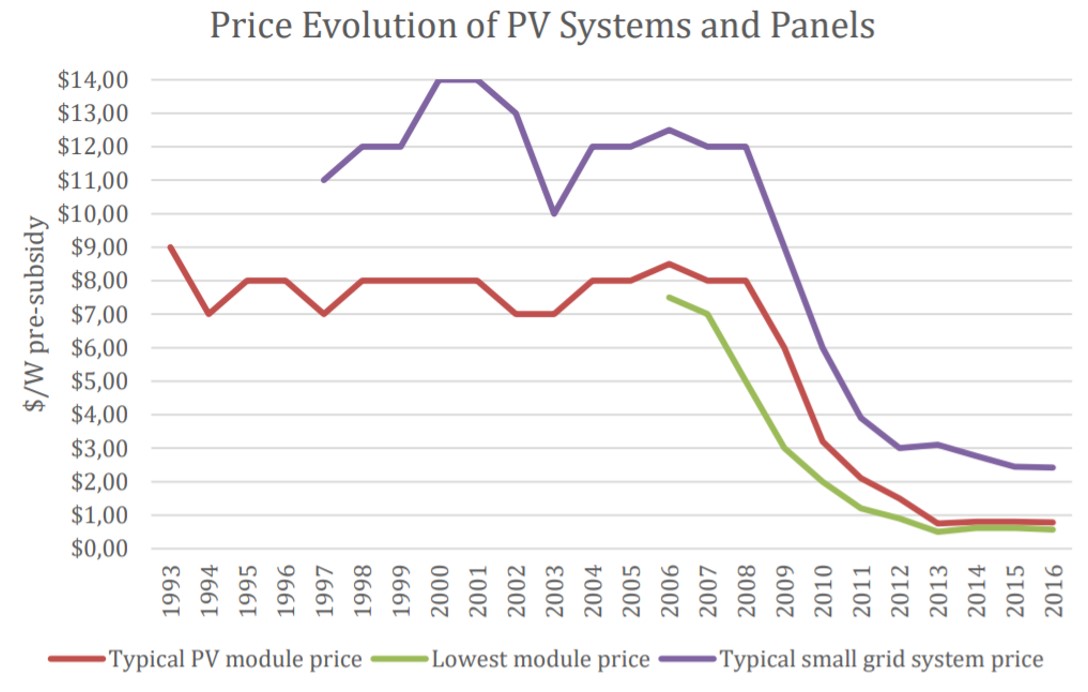
Figure 2 Price evolution of PV Panels and Systems (Johnston, W & Egan, R 2016. National Survey Report of PV Power Applications in Australia 2016)
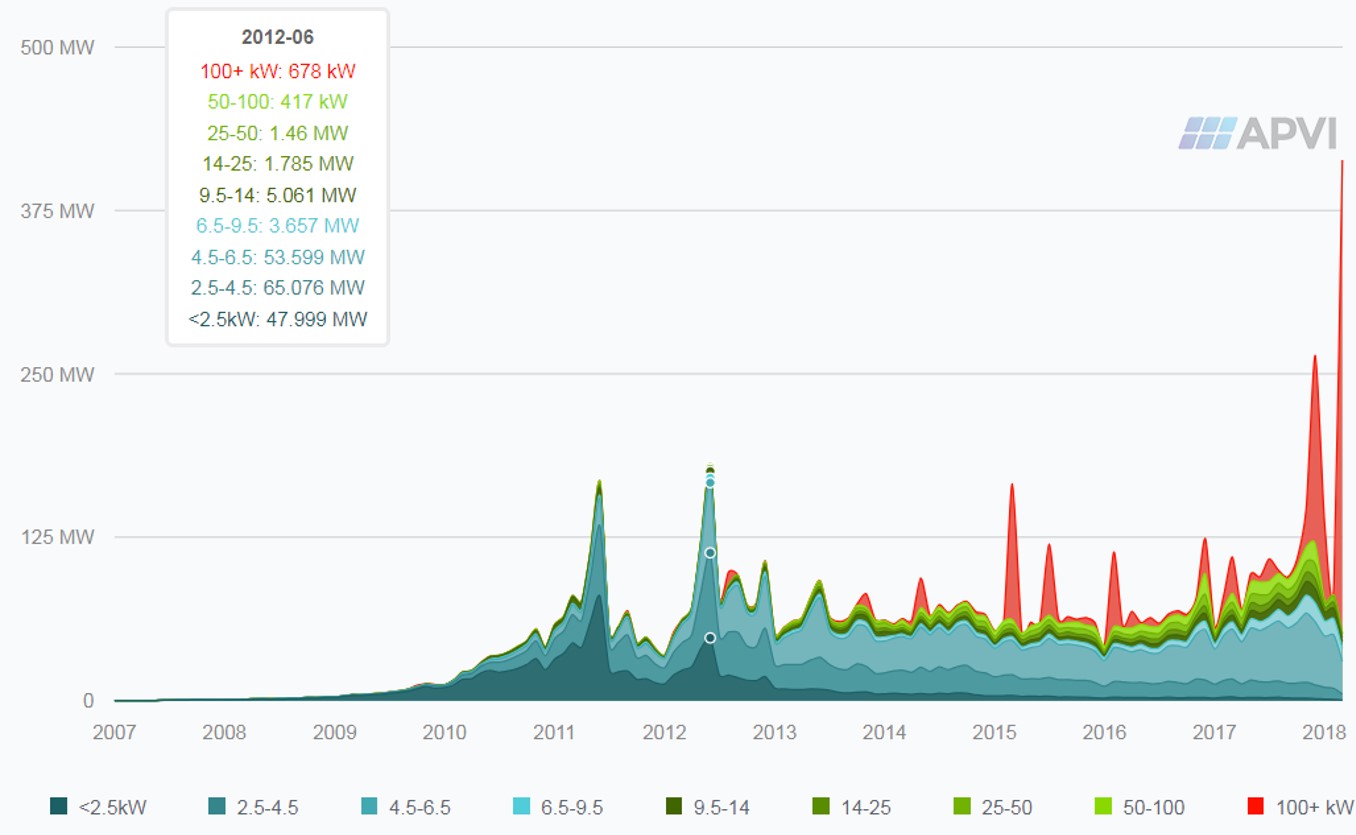
Figure 3 Monthly data for PV installations in Australia with the record installs in June 2012 (figures for end half of 2017-18 do not include installed systems that have not surrendered SRET certificates) (http://pv-map.apvi.org.au/postcode)
This ‘solar rush’ started a boom for the solar PV installation industry. The amount of solar being installed between 2008 and 2012 led to 11,600 jobs being created in the installation industry. The competition between installers led to efficiencies in installation techniques and means that Australia now has the lowest installation costs in the world.
The perfect storm
This perfect storm of excellent resource, high subsidies, high energy prices, falling module costs and cheap installation rates meant that by the end of 2012 Australia was leading the world with the highest percentage of households with solar PV installed, an average of 15% of households across the country. This also meant current FiT rates would be unsustainable. The unexpected rapid take-up of solar meant that more money than expected was being paid in subsidies. The cost of these subsidies were paid for by all energy consumers as part of their household bills.
As the costs for solar installations kept reducing the states quickly sought to address the problem of high subsidies and reduced the FiT rate. The reductions in the FIT rate still left anyone installing the system under the new rate with a typical 3-4 year payback period on the installation costs of the system.
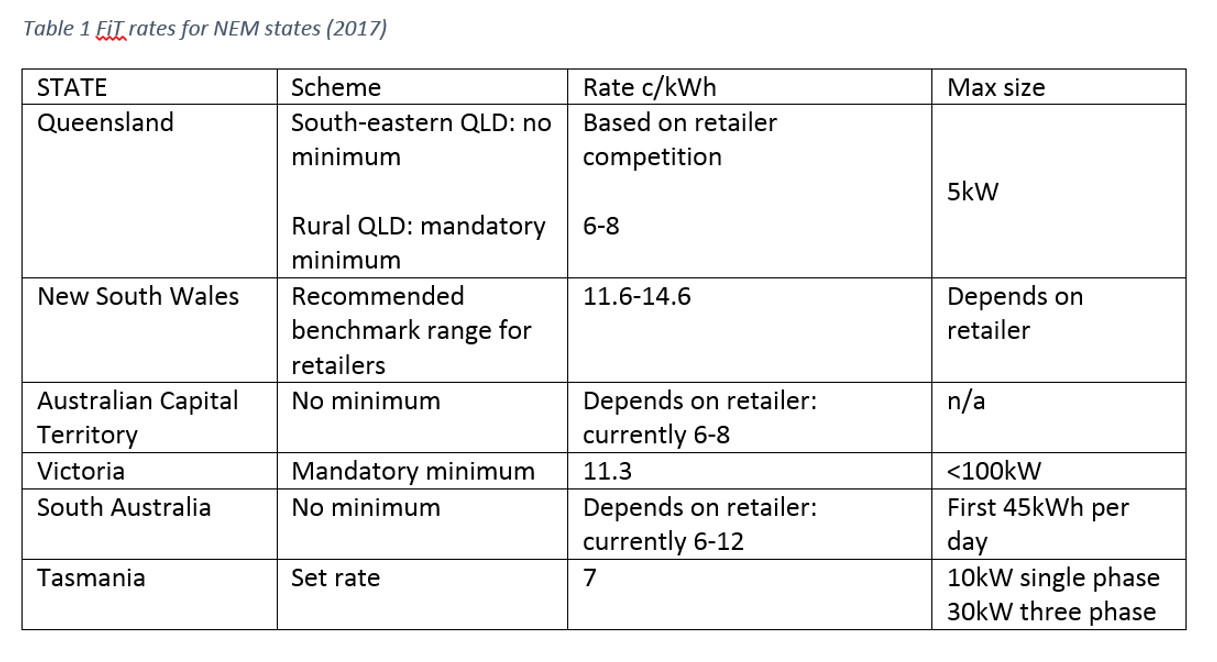
In 2013 FiT rates across all the states were reduced and changed to a Net FiT (with the exception of Queensland) so that householders would only be paid for what they exported to the grid. Following even more reductions in the cost of a PV system, on the 31st December 2016 all SBS and FiT schemes in all the states ended. Only those in receipt of the initial pre-2012 Premium FiT payments had these payments grandfathered. FiTs are now paid by the retailer with no mandatory minimum requirement. The states are able to set minimums or provide benchmark ranges as a guide for retailers if they wish (Table 1).
A shock to the system
Towards the end of 2016 and in early 2107 there were two shock events which caused a spike in the installation rates of PV (Figure 3), both at a domestic level and at a commercial level. The first was in September 2016 when a massive storm caused the Heywood interconnector, which links the states of South Australia and Victoria, to fail. This then caused a blackout for the whole of South Australia.
In early 2017 another climatic shock event saw yet another peak in the installation of PV (Figure 3). During a heatwave in South Australia 90,000 homes were left without power as the market operator committed to a load shedding event due to failures of its fossil-fuel generators.
These events and the fact that it was now possible to install a 5kWp solar PV system for roughly £3000 led to a surge in PV installations as consumers felt that PV would give them more reliability in the face of a blackout and help to reduce their ever increasing energy bills. By the end of 2016 25% of households across all Australia now had solar PV installed on their roofs
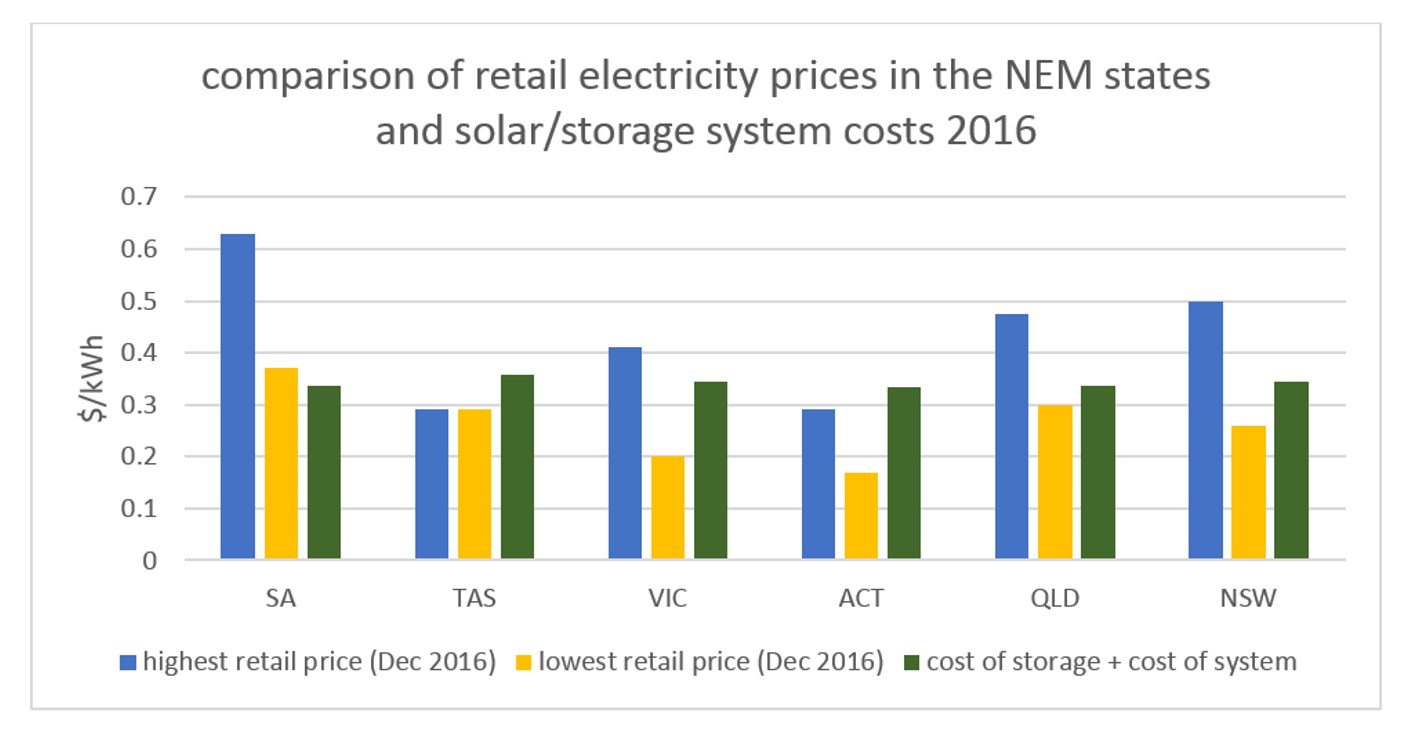
New Storage Options
At the end of 2016 there was also an announcement by Tesla that they would be introducing their new Powerwall 2.0 in Australia at the same price as the Powerwall 1. This essentially halved the cost of storage as the Powerwall 2.0 had double the storage capability. This also meant that other domestic storage companies had to reduce their prices in order to remain competitive. The result of this meant that in some states installing solar PV plus storage became competitive with grid supplied electricity.
Figure 4 Cost of a solar/storage system (based on Powerwall 2.0 cost) assuming lifespan of 10 years for both (after 10 years costs drop to $0), costs for PV taken from solar choice.net.au and solar resource and household electricity use for each of the capital cities calculated for each of the NEM states. No allowance has been made for FiT payments to give an idea of the economics of disconnecting from the grid.
Consumers lack confidence in the energy market
Energy Consumers Australia (ECA), a government body representing consumers in the National Energy Market (NEM) run a biennial Consumer Sentiment Survey. In 2017 findings included:
- A reduction in the satisfaction with value for money of electricity, with the decrease in the ACT at 11% and in Victoria at 11% (compared with the previous survey in 2016).
- A reduction in the satisfaction of reliability across all energy markets.
- A reduction in the level of competition
- Only 21% of consumers had confidence that the energy market was working in their interests.
ECA also noted that very few customers were switching between energy companies. Reasons given for this was the huge array of deals available, with a range of discounts and different rates for paying on time or if you have solar etc. In interviews undertaken this year with energy system experts there was a consensus that wading through the mire of different energy deals was difficult and time consuming even for energy experts. The confusion still occurred when using the government comparison websites which could return up to 20 different energy deals.
Until July this year, retailers were able to offer discounts that, once the discount period ended, would cost the customer more than the standing offer price for electricity. The standing offer is a regulated price set by the local (state) government. It is now also mandatory through a new rule this year for all retailers to make the standing offer available which gives customers a benchmark figure to compare deals.
2017 A Record Year for PV and storage
The continuation of rising electricity prices, reliability concerns and consumers’ confidence in the energy market at an all-time low, coupled with the favourable economics of owning PV and storage has meant that there have been record installations of PV in 2017. In 2017 alone 1057 MW of small-scale solar was installed (figures for the end of 2017 and beginning of 2018 have not been updated on the APVI website(Figure 3)), higher than the previous record peak in 2012. This figure of 1057MW represents a 41% growth compared to 2016.
By the end of 2017 the Clean Energy Council report, using data from SunWiz, reported that 28,000 battery systems had been installed. SunWiz estimated that 42% of this figure was in NSW. With NSW currently installing more rooftop solar per month than the other states, the fact that such a large percentage of this includes a battery system means that there could be complications for the market and an increase in prices for those unable to install solar.
The challenges of high DER penetration
Currently the Australian Energy Market Operator (AEMO) has visibility of domestic scale PV due to the SRES certification scheme. AEMO is able to see the size, location and density of the PV installations which helps AEMO with forecasting demand over different areas. The same is not true for battery storage. As there are currently no certificate schemes or tariffs for household batteries, if a customer installs a battery it is invisible to AEMO. For AEMO this means that forecasting grid demand becomes more difficult. The ‘duck curve’ – the midday dip in demand followed by a sharp peak caused by domestic solar feeding into the grid – will become flatter as householders store power during the day and use the stored power in the evenings, however AEMO will not be able to predict by how much and where.
The amount of solar now on the grid has led to problems for the networks, because they have not upgraded them sufficiently to allow for more flexible operation. There are constraints on the distribution grid as two-way flows of energy is something for which it was not designed. PV systems have led to voltage problems as the PV system increases the voltage on the 11kV line which can lead to transformer malfunctions if the voltage regulation is incorrect. A high penetration of PV can also reduce the frequency of the network, something which could cause a black out of the entire system. These network problems, and the costs associated with rectifying them, are some of the reasons that retailers are now charge a standing charge to customers so that solar owners are seen to be paying their ‘fair share’.
In 2016 25% of Australian households were paying virtually nothing towards the costs of being attached to the grid. In order to counteract the lack of revenue coming from solar owners the energy retailers introduced a standing charge of between Au$500 to Au$1000 p.a. for all customers. The standing charge increases the amount that PV owners have to pay for their electricity. Although seen by some as a fair solution to the problems caused by increasing PV penetration, paying increasing fixed costs could also encourage solar owners to go off grid, which would then leave even less customers for the networks to recoup their costs. Those customers who are then unable to install DER such as renters, low income households and people living in apartment buildings would then be left to pay ever increasing energy costs.
Do Australians need or want the grid?
It is now so inexpensive to install a solar system that the cost of adding a battery storage system is not so much of a prohibitive factor as it could be in some other countries. PV and storage is now at grid parity or less (meaning the cost per kWh is the same as the retail price). Moreover, the quality of the solar resource means that it is possible for a household to generate and store almost enough electricity for their needs using a small diesel generator as back-up (which could lead to higher emissions and poorer air quality). This combination of the cost of installations and the amount of available solar energy and the standing charge means that it can make economic sense to go off grid – i.e. complete separation but with potential negative impacts for the environment.
It is the economics of PV and storage ownership and customers lack of trust in the energy companies and energy market that could lead to those customers who can afford to making the choice to leave the grid entirely.
The policy response to DER
Until this year the main policy response to the DER uptake in Australia has been to slash FiTs and add a standing charge to customer bills. Policy and regulation is constantly playing ‘catch up’ with a governance structure that is slow to adapt to the unexpected rapid transformation that is happening. As described by one commentator talking about regulation in Australia,
‘just trying to keep up, and you start to run over here to deal with this problem, as you are running over here, something pops up behind you.’
One solution that is being proposed is to create a DER optimisation framework which gives DER the opportunity to provide grid services which in turn could reduce network costs and reduce the amount of new generation capacity required in the future.
In June this year, AEMO and the ENA released a consultation paper on ‘how best to transition to a two-way grid that allows better integration of Distributed Energy Resources for the benefit of all customers’. AEMO and the ENA have given possible frameworks for integrating DER:
- A single integrated platform where the market operator provides a central platform in which all distribution level actors are able to participate.
- A two-step tiered platform in which the DNO’s are responsible for optimisation and DER dispatch within their own network areas
- An independent distribution service operator (DSO) or AEMO optimising distribution level dispatch which would involve either an overarching iDSO or multiple iDSO’s at the individual network level.
Within the report the agencies recognize the value that DER could bring if given an effective framework in which to operate. This is in comparison to the current poor management which would increase costs for everyone. Although AEMO and the ENA have released a consultation document to find value for DER customers and reduce overall costs for everyone, this relies on customers happily engaging with retailers and aggregators. As the ECA have pointed out, there is a high level of mistrust of energy companies amongst these customers, something that has also been recognized by the AEMC.
Also in June this year the AEMC, recognising the difficulties of invisibility of DER to AEMO, released a draft ruling for a national register of small scale batteries and other DER. Consultations on the draft ruling do not close until August. At best, the rule could then be expected to take a minimum of 6 weeks after submissions have closed to become effective. The new national register will only include DER installed after the new rule is finalised. This means that any small-scale batteries that have been installed up to the start of the new ruling will still be invisible to the market operator.
The problem with designing policy in a reactionary way is that policy and regulation is constantly trying to catch up with events. The speed in which institutions are able to change rules and regulations are slower than the current speed of transformation in Australia. Initial policy was not designed with the thought that it might be overly successful. This unexpected success has meant that the regulator and market operator are in a constant game of ‘whack-a-mole’ as they rush to find a solution to one problem and another appears. Conversations in Australia are now around how the roles of the institutions should change to being less prescriptive and should concentrate more on industry codes and public protections. These codes and protections would then allow for new technologies and business models to be adopted in the domestic sector without detriment to either the system or the consumer. There are also conversations around whether regulation for electricity should be brought back to the state regulator, rather than the national body, the Australian Energy Regulator (AER). The suggestion is that as the electricity system becomes more decentralised so a local regulator would be better placed to look at local issues.
The good news is that policy is recognizing that DER is an asset for the electricity system and that creating value for DER owners will give them reason to stay on the grid. The bad news is that, due to the current slow response to change, those who are expecting customers to engage with the new energy system will need to ensure that they are kept happy now, as by the time the consultation processes are finished and a new framework is applied their customers may have chosen a different path.
The lesson for the UK is that we still have time to create a governance structure that is adaptable so that energy system transformation will benefit everyone but this new, flexible and adaptable structure needs to be in place now, before the unexpected happens.
Posted by: rhoggett
Related Posts
« Previous Global Insights: 24th July 2018 Presentation: 4th Energy and Society Conference – Keynote presentation by Catherine Mitchell Next »
