|
This page provides essential information to help users fully exploit my Java applet.
Although I have designed my program to make pipe network entry simple and effortless,
the knowledge of how my program operates and how data should be entered is extremely
valuable and will result in a fast, efficient and trouble-free experience.
System Requirements Before you can input anything into my Java applet you will need to get it running on your particular system. This should be simple. My program is basically Java code embedded into a web page, so that it is made accessible to users over the whole Internet. You must satisfy the following: 1 - Use a computer that has reasonable performance, anything fairly recent will be adequate since I have specifically designed for my program to be as small and as efficient as possible. Systems above 200Mhz processors and 32mb RAM would be sufficient. 2 - An Internet browser is required. I have tested Internet Explorer, Netscape and Opera, and they are all suitable. Please use an up to date version. Older versions will experience difficulties, in particular Netscape! Browser updates are freely available from either: http://www.microsoft.com, http://www.netscape.com or http://www.opera.com. 3 - A Java Runtime must be installed and enabled. My Java applet will not run if Java is not available. I have used Java 2 version 1.3 whilst developing, however any release from v1.1 to the most recent v1.4 correctly runs the applet. Updates are available from Sun's home page http://www.java.sun.com, download the runtime edition if required. If the applet is loaded and running you are now ready to read on. How to use my Java Applet for Pipe Networks The aid of a diagram, showing the full pipe network you wish to enter, will help you easily and quickly input the required data, it is not essential but merely an aid to ensure you use correct information. Navigation of my Java Applet My applet layout consists of five different pages, or cards, which should be completed before progressing in turn to the next section of the program. Clear and precise instructions are given at the bottom of the applet which will help and alert you should an error be made. Navigate the different cards using the 'next' and 'back' buttons provided and not browser buttons. The first card is for the input of node or pipe junctions. The grey rectangle to the left is called the Canvas and will accept mouse inputs and will also draw the pipe network as you progress. To enter your nodes just click at the relevant locations on the Canvas. If you make a mistake a reset button is provided to clear all node data. Once complete click the top left button to switch to the pipe card. The next card should be used to enter all the pipes and corresponding pipe information. Pipe details should be entered in the boxes provided. Length and diameter data should be given exactly and with units of Metres, Roughness coefficient for the pipe should also be completed. The table below gives some useful Hazen-Williams coefficients for various types of pipes. The Hazen-Williams value MUST be used in my program. Do not use a Manning coefficient they are given as a guide to convert to a Hazen-Williams coefficient. |
| Pipe Material | Manning ( n ) | Roughness coefficient ( C ) |
| Plastic, Copper | ||
| Smooth Concrete | ||
| New Iron | ||
| Ordinary Iron | ||
| Very rough or corroded |
|
Once data has been entered please press create pipe button. You will then be
prompted to select the start and end nodes for this pipe. The pipe will be drawn in red
onto the Canvas. Pipe Information will be shown below in the log for your reference.
If an error is made the last pipe may be deleted and re-entered if required. If all
pipes have been entered then progress onto the next card.
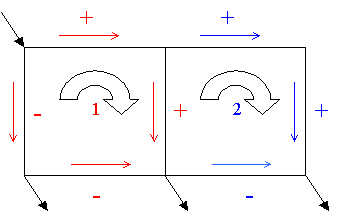
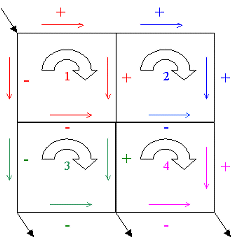
Loops that are created from a number of pipes must be entered on the Loop Card. Simply select the first pipe of a loop and add it to the list using the add pipe button. Continue to add pipes to the list until all pipes in a loop are shown. Now click create the loop button to form a loop. NOTE: The order in which you enter the loops is important for the next card, so enter the loops in a logical order. All loop information is shown again in the log and information at the bottom will guide you. Once all pipes have been entered into loops, move onto the next card. The final card, before the result information is given, involves entering assumed flow rates. This is necessary to inform the program about inflow and outflow to the system. The program requires an approximate figure on which to begin calculations but the following rules must be adhered to closely. i - The inflow and outflow to each junction must be in equilibrium. ii - Every pipe should have a non-zero volumetric flow rate assigned to it. iii - Flows must be set so that total flow in and out of the system is correct. iv - Extreme care should be given to the direction of flow. Clockwise flow should be set to positive, anticlockwise flow should be set to negative. Please see the example below; |
| Consider the following network with two loops. Loop One was set first, two flows are in the clockwise direction, two in the anticlockwise direction. Hence their flows are two positive and two negative. The next loop to be entered was Loop Two. In this loop, two more flows are clockwise and become positive but only one flow is left without being defined and this becomes negative as shown. NOTE: The pipe belonging to BOTH loops is assigned its sign from the first loop and not the second. |  |
 |
This second example is a network with four loops. Again we can see progression of assigning flow values around the network. Loop One has all four values set according to initial conditions in that first loop. Loop Two has three values set as in the first example. Looking now at Loop Three, the pipe it shares with Loop One has already been assigned so we ignore this and set the remaining flows. Loop Four has two of its pipes previously set so only the remaining two pipes must be assigned values. |
|
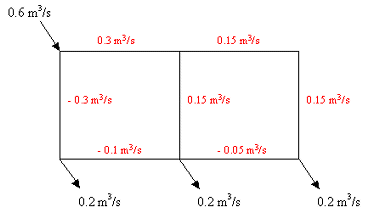
After the flow rates have been signed correctly, they also need an approximate value set. This
must not be zero or the calculation will always produce a zero flow rate. The easiest way is to
equally divide the flow at each junction. NOTE: Inflows and outflows to the network must be
accounted for in these figures. The figure below gives an easy to follow example showing correctly
how to assume an approximate flow value.
If an error is made inputting flow rate data the incorrect value may be safely overwritten by re-entering the flow rate for that particular pipe. Instructions are again given at the foot of the applet. All data should now been successfully inputted.  |
|
Final card - The Calculation card with results The last card of my Java applet is responsible for the calculation. The network is redrawn for the users information. Simply press the calculate button and sit back. You may check the location of any pipe in the network by hovering over the Canvas with the mouse. The text will inform you as to which pipe exists in each location. Final exact volumetric flow rates are shown in the log. If any data is missing and the program cannot continue then an error message will be displayed and users should check that all data has been entered. The log will give details of the number of iterations the program took to produce a final result. Calculation progress is shown at all times in the browser Status bar. |
| Goto my Applet | Home |