With both the Fab affinity and cross-reactivity screening and the Fc region Protein A/G we are able to provide a characterisation of both important ends of the antibody.
Aims and Objectives
The project is measuring the concentration of specific antibodies in serum following a vaccination event to determine their affinities for the target immunogenic proteins. Purified antibodies can also be screened for their Fab region affinity to their target proteins and cross-reactivity towards a panel of other proteins. The Fc region affinity for Protein A/G can also be determined to characterise Fab and Fc affinities of antibodies.
- Antibody screening for autoimmune diseases
- Antibody cross-reactivity screening
- Antibody Fab affinity screening
- Antibody Fc affinity screening for the interaction with protein A/G
Reference
Olkhov RV, Parker R, Shaw AM
Whole blood screening of antibodies using label-free nanoparticle biophotonic array platform. Biosens Bioelectron 36(1):1-5 Jun 2012
Antibody Serum Screening for Vaccine Efficacy and Autoimmune Disease Diagnosis
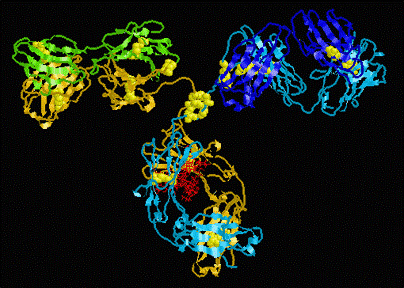
Figure 1. RASMOL Image of an IgG showing the upper Fab regions and the lower Fc region.